Product adoption strategies that hold up after launch
A practical guide to product adoption strategies: the five stages, the metrics to track, the events to instrument, and the experiments that move users from sign

Open your analytics dashboard right now and look at where users drop off after signup. That number, wherever the cliff is, is the real starting point for product adoption strategies. Not the signup count. Not the activation rate you reported last sprint. The cliff.
Most adoption problems are not one broken thing. They are a broken handoff between stages that nobody owns clearly. Fix the handoff, and the metric moves. Redesign the whole onboarding flow, and you may spend six weeks on the wrong problem.
What product adoption strategies actually have to solve
Why signup is not adoption
A signup is permission to try. Adoption is repeated, value-driven use. The user comes back because the product did something useful, not because you sent a re-engagement email. PostHog's retention and expansion handbook draws this line clearly: retaining a user means getting them to a point where the product is load-bearing in their workflow, not just visited.
The gap between a signup spike and actual adoption is where most PLG products leak. You can have 500 signups and 20 active users. Those are not two versions of the same number. They are two different problems.
The cost of treating activation like a vanity metric
On a previous project, I shipped a new onboarding checklist and watched activation jump 30% in a week. We celebrated. Two weeks later, day-14 retention had not moved. The users who completed the checklist were not coming back. They had ticked the boxes and left.
Tour completion, first login, and checklist progress can look like activation. They are not. Real activation means the user experienced the product's core value, not that they clicked through the welcome flow. If you cannot point to the moment a user "got it," your activation metric is measuring the wrong thing.
Map product adoption strategies to the five-stage path
The five stages from signup to habit
Treat adoption as a sequence, not a single metric. The five stages are:
- Signup — account created, intent declared
- Activation — user experiences core value for the first time
- First value — user completes a meaningful task and sees an outcome
- Repeat use — user returns and uses the product again without prompting
- Habit — the product is embedded in the user's regular workflow
Each stage has a different job. What moves a user from signup to activation is not the same as what moves them from repeat use to habit. If you treat them as one problem, you get a one-size-fits-none solution.
Where the operating system breaks if you skip a stage
Teams routinely try to drive habit before they have fixed activation. They build referral programs when users are not returning. They invest in email sequences when users have not reached first value yet. The funnel looks busy, with lots of experiments running, but adoption stays weak because the earlier stage is still leaking.
The a16z product-market-sales fit conversation makes this point directly: adoption has to be earned stage by stage, and complementary services like CS, sales, and onboarding cannot paper over a broken earlier stage. Fix the earliest leaking stage first.
Which stage owns which team
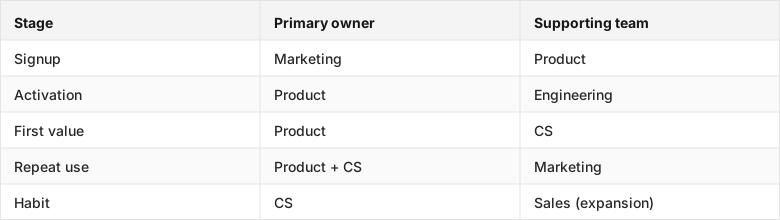
The handoff between activation and first value is where small teams most often have a gap. Product built the flow, CS does not engage until the user is already churning, and nobody owns the middle.
Track the few adoption metrics that actually tell you something
Activation, time-to-value, feature use, retention
Four metrics cover the whole funnel. The question is not which ones to track. It is which one deserves your attention at each stage.
- Activation rate — percentage of signups who hit your defined activation event. This is the first metric to fix if you're early.
- Time-to-value — how long between signup and the activation event. Shorter is usually better, but only if the value is real.
- Feature use — which features activated users actually use. This tells you whether your adoption metrics are measuring the right event.
- Retention — day-7, day-14, day-30 return rates. This is the lagging indicator that confirms whether activation was real.
Fix activation before you optimize retention. If users are not activating, retention data is noise.
The table that turns stages into measurements
Here is the operating system in one view. Each stage gets one primary metric, one event to instrument, and one experiment to run.
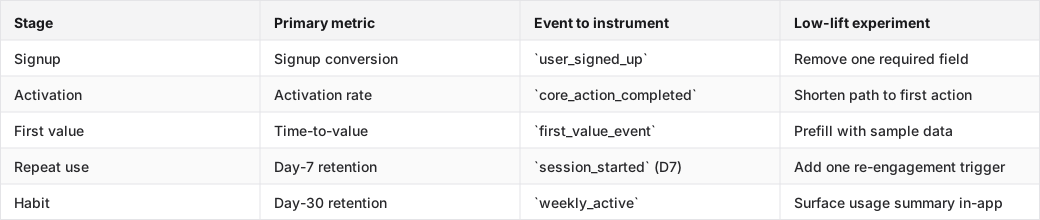
One experiment per stage. Run them sequentially, not in parallel, or you will not know what moved the metric.
Instrument the funnel before you add more onboarding
What to instrument first in your event pipeline
Before building anything new, instrument these five events. They are the minimum viable event plan that reveals where users stall, and a product engineer can ship them in a day:
- `user_signed_up` — timestamp, source, plan
- `onboarding_step_completed` — with a `step_name` property for each step
- `core_action_completed` — your single most important product action (sending the first message, creating the first project, running the first report)
- `session_started` — every time a user returns
- `feature_used` — for the two or three features most correlated with retention
That is enough. Do not instrument everything. Instrument the events that answer: did the user get value, and did they come back? PostHog's cross-sell motion guide notes that timing product adoption matters, which means you need the event data to know when users are ready for the next step, not just whether they signed up.
How to tell real adoption from vanity activity
Page views, tour completions, and help doc visits can look like engagement. They do not predict retention.
The events that predict repeat use are the ones tied to the user doing something in your product, not consuming something about your product. `core_action_completed` is the line. If a user crossed it, they reached real activation. If they watched the tour and left, they are still just a signup.
Run a cohort analysis: users who completed `core_action_completed` vs users who did not. If day-7 retention is materially higher in the first cohort, you have found your real activation event. If it is not, your activation definition is wrong. Find the event that does predict retention and instrument that instead.
Use low-lift experiments to improve product adoption this week
The highest-leverage changes a small team can ship now
The fastest activation wins usually come from removing friction, not adding features. Three experiments worth running this week:
- Remove one required field from signup. Every extra field is a drop-off point. If you're asking for company size, job title, and use case before the user has seen the product, cut two of the three.
- Change the default data. Empty states kill activation. Pre-populate the product with sample data so the user sees what "done" looks like before they've done anything.
- Shorten the path to the core action. Count the clicks between signup and `core_action_completed`. If it is more than five, find the step you can remove or defer.
None of these require a redesign. All of them can ship in a sprint.
How to reduce onboarding friction without overbuilding
The instinct when activation is low is to build more onboarding: more tooltips, more checklists, more guided tours. This usually makes it worse. More UI is more friction.
The constraint-based approach is simpler. Pick one step in the onboarding flow with the highest drop-off rate. Ask why a user would stop there. Then remove or simplify that one step. Do not touch anything else. Measure for two weeks. Then pick the next one.
That is slower than a full redesign. It is also the only approach where you know what moved the metric.
The before-and-after change that proves the point
Linear's onboarding is a frequently cited example of this working at scale: they removed the "invite your team" step from the critical path and made it optional. The step was not wrong, because teams do need to invite colleagues, but it was blocking solo users from reaching their activation event. Moving it post-activation increased their activation rate without touching anything else in the flow.
The mechanism is simple. They found one broken handoff, removed it, and measured. No redesign. One change, one metric, one experiment.
---
FAQ
Q: What are the highest-leverage product adoption changes a small team can ship this week?
Remove one required signup field, prefill the product with sample data, and shorten the path to your core action. These three changes address the most common activation blockers: friction at signup, empty-state confusion, and too many steps before first value. Pick the one your drop-off data points to first.
Q: Which adoption metrics should we track first: activation, time-to-value, feature use, or retention?
Start with activation rate. If you do not know whether users are reaching your core action, everything downstream is noise. Once activation is defined and measured, add time-to-value to see how fast users get there. Feature use and retention come after. They are confirmation metrics, not diagnostic ones.
Q: How do we reduce onboarding friction without overbuilding the experience?
Find the single step with the highest drop-off rate and remove or simplify it. Do not add more guidance. Add less process. Prefilled data, optional steps, and shorter paths consistently outperform longer checklists and more tooltips. Measure for two weeks before touching anything else.
Q: How do we tell whether an adoption experiment worked or just increased vanity usage?
Check whether the experiment moved your downstream metric, not just the surface one. If you shortened the onboarding flow and activation rate went up but day-7 retention did not move, the change produced more shallow activations, not more real ones. The follow-through metric, whether retention, repeat use, or feature use in activated users, is what confirms the experiment worked.
Q: How should product adoption strategies differ for self-serve PLG products versus enterprise products?
In self-serve PLG, the product owns activation. There is no sales rep to intervene, so the onboarding flow has to get users to first value without human help. Instrument everything, experiment fast, and measure time-to-value obsessively. In enterprise, a human, such as CS, implementation, or sales, owns the activation handoff. The product's job is to support that human with data and in-app prompts, not to replace them. The feedback loop is also longer: enterprise users take weeks to activate, not hours, so experiment cycles are slower.
Q: What does a practical adoption playbook look like from signup to habit formation?
Five stages, one metric each: track signup-to-activation rate, time-to-value at activation, feature use at first value, day-7 retention at repeat use, and day-30 retention at habit. Instrument the five events that cover those stages. Run one experiment per stage, starting with the earliest leaking stage. Assign clear ownership at each handoff. Product owns activation, CS owns the repeat-use-to-habit transition, and nobody owns "adoption" as a whole without owning a specific stage.
Conclusion
Go back to the dashboard you opened at the start. Find the biggest drop-off in the funnel. That is your stage. Pick one metric for that stage from the table above, instrument the event that measures it, and ship one experiment this week. Not a redesign. One change. The operating system only works if you run it one stage at a time.
Explore what the Inkly demo agent can do beyond a single demo.
Ship your next demo before the meeting starts
Interactive demos built from your real product and kept current as you ship, done for you.


